
Have you ever found yourself in marketing, wanting to predict sales and gathering a ton of data? For example, let's say you have sticker sales data (1) like the set below. The num_sold column represents the number of units sold. This is actually a large dataset with over 200,000 entries. So, among these data columns (which we call "features"), which one is the most important for predicting sales? They all seem important, and it's impossible to check all 200,000 records one by one. So, let's try asking the generative AI, GPT-5.
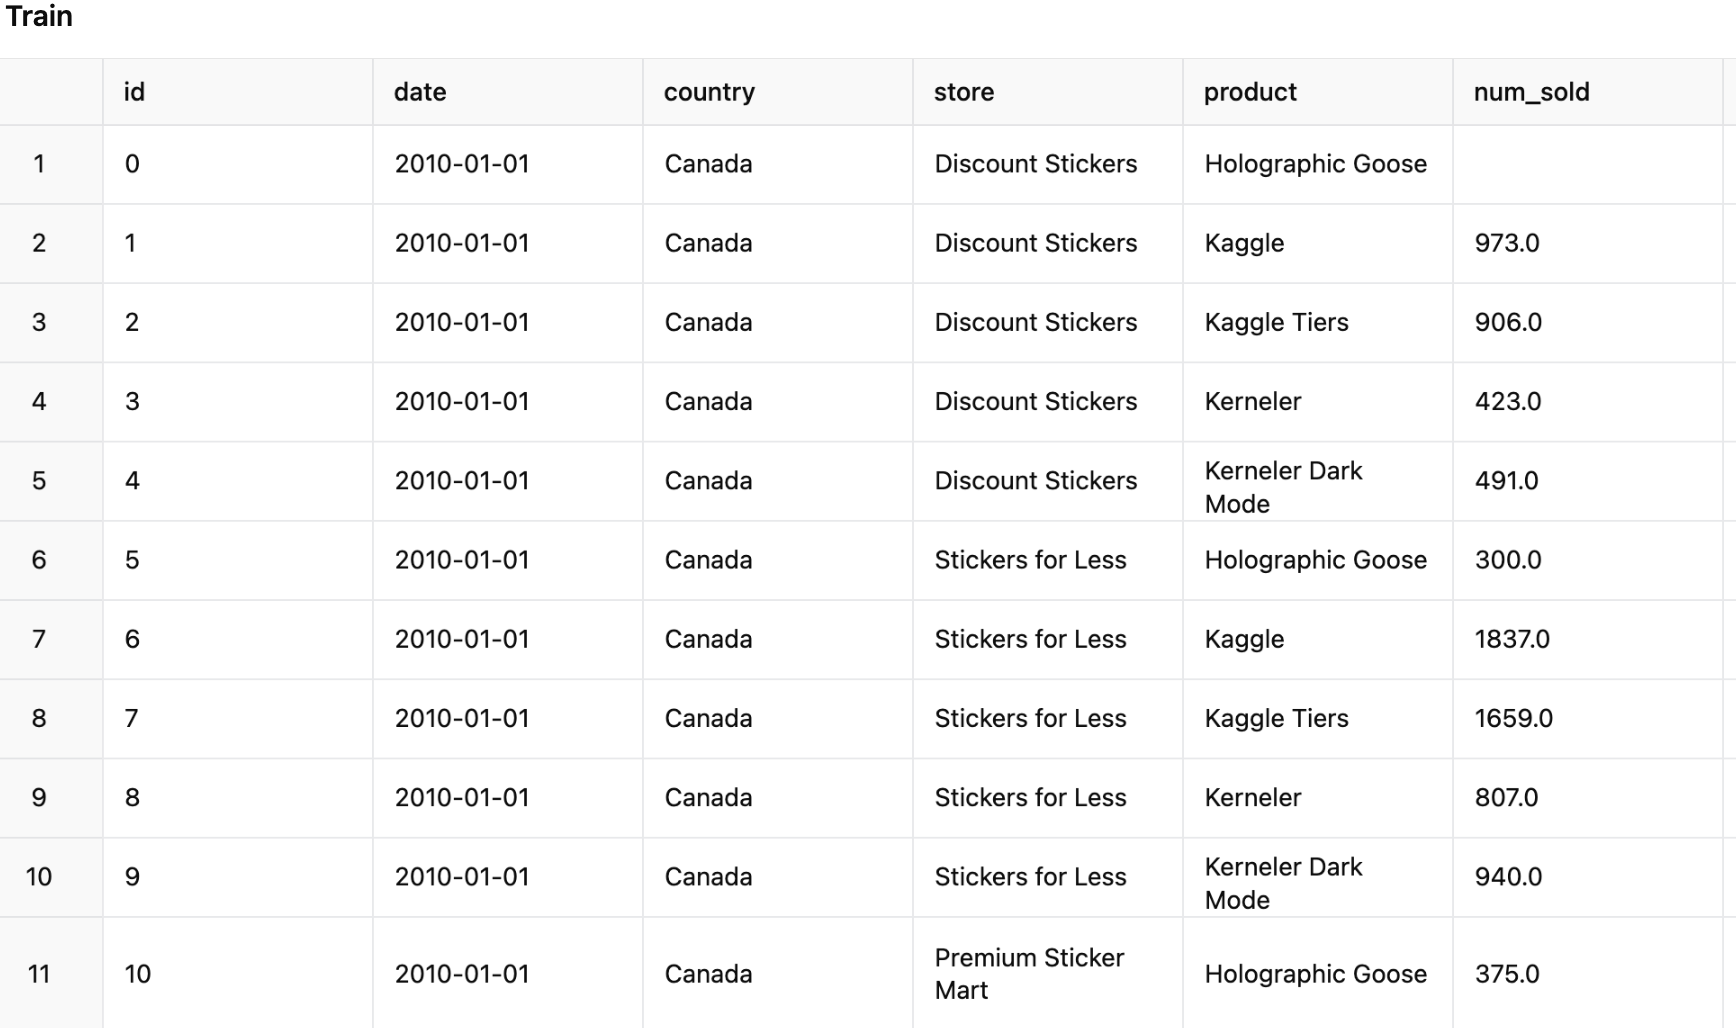
Sticker sales data
1. Asking GPT-5 with a Prompt
To identify the important features for a prediction, you first have to create a predictive model. This is a task that data scientists perform all the time. However, they usually create these models by coding in Python, which can be a high barrier for the average business person. So, isn't there an easier way? Yes, and this is where prompts come in handy. If you can give instructions to GPT-5 with a prompt, no coding is necessary. Here is the prompt I created for this task.

data & prompt
Key points of the prompt:
Use HistGradientBoostingRegressor from sklearn.
Evaluate the error using mean_absolute_percentage_error.
Split the data into train-data and test-data at an 80:20 ratio.
Display the top 10 feature importances with their original variable names.
Print the results as numerical output.
By getting the top 10 feature importances, we can understand which data column is the most significant. I won't explain the predictive model itself this time, so for those who want to dive deeper, please refer to a machine learning textbook.
2. The Code Actually Being Executed
Based on the prompt above, GPT-5 generated the following Python code on its own. It might look complicated to non-specialists, but rest assured, we don't have to touch Python at all. However, we can review this code to see how the calculation is being done, so it's by no means a black box. I believe this transparency is very important when using GPT-5 in a business context.

GPT-5's code for building the prediction model
3. "Product" Was the Most Important!
Ultimately, we got the following result.
Feature Importance Ranking
A higher "importance" value in the table above means the feature is more significant. This analysis revealed that "product" was overwhelmingly important. It seems that thinking about "what is selling" is essential. This is followed by "store" and "country". This suggests that considering "in what kind of store" and "in which country" is also crucial.

feature importance ranking
So, what did you think? This time, we instructed GPT-5 with a prompt to calculate which features are most important for predicting sales. It's true that you might run into errors along the way that GPT-5 has to correct itself, so I felt that having some basic knowledge of machine learning is beneficial. However, we were able to get the result without the user having to write any Python, which means marketing professionals can start trying this out today. I hope you can use the method we introduced today in your own marketing work. That's all for now. Stay tuned!
You can enjoy our video news ToshiStats-AI from this link, too!
1)Forecasting Sticker Sales, kaggle, January 1,2025
Copyright © 2025 Toshifumi Kuga. All right reserved
Notice: ToshiStats Co., Ltd. and I do not accept any responsibility or liability for loss or damage occasioned to any person or property through using materials, instructions, methods, algorithms or ideas contained herein, or acting or refraining from acting as a result of such use. ToshiStats Co., Ltd. and I expressly disclaim all implied warranties, including merchantability or fitness for any particular purpose. There will be no duty on ToshiStats Co., Ltd. and me to correct any errors or defects in the codes and the software.